Thursday, July 29, 2010

Landmrk & DNP broke above their downtrend

The listing of Ivory Properties Group Bhd ('Ivory') on our exchange yesterday has been a real boon for investors with exposure to property stocks. Ivory gained 30 sen to close at RM1.30. The sharp gain for Ivory sparked a rally in many property stocks. Below are two quiet stocks which managed to break above their medium-term downtrend line. These stocks- Landmrk & DNP- could be good trading BUY.


Chart 1: Landmrk's daily chart as at July 29, 2010_9.30am (Source: Quickcharts)


Chart 2: DNP's daily chart as at July 29, 2010_11.00am (Source: Quickcharts)

Wednesday, July 28, 2010

P&O- a value stock with a bullish breakout

Once in a while, a research report came to your attention and made you sit up. Recently, Kenanga Research issued such a report. It's the initial report on Pacific & Orient Bhd ('P&O'). The gist of the report is as follows:

1) P&O will take pole position in the market for motorcycle insurance business.
2) It's extremely cheap, trading at a PE of 3 times FY2011 earning or 0.55 times its book value.
3) Based on (2), its base case valuation is about RM1.15- giving an upside of 92% from its then close of RM0.63.
4) There is potential for M&A as the general insurance sector is quite fragmented & the owner is contemplating divesting his shares in P&O. Based on Price to Book of 4.2 times, P&O's M&A valuation could be about RM1.65.

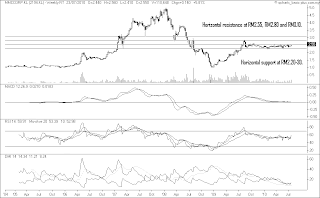
While P&O's valuation is very undemanding, I found it very hard to get excited about a company that is so dependent on motorcycle business. A quick look at the chart (plotted on logarithmic scale) made me reconsider my skepticism. The stock looks set to break above its long-term downtrend line at RM0.75. As at 3.00pm, P&O was trading at RM0.79- gaining 8 sen above its close of RM0.71 yesterday.


Chart: P&O's monthly chart as at July 5, 2010 (Source: Tradesignum)

Based on cheap valuation & bullish technical outlook, P&O could be both a trading BUY & a long-term BUY.

Tuesday, July 27, 2010

RHBCap surpassed its 2007 high

RHBCap has just broken its 2007 high of RM6.29-30 yesterday (see Chart 1). Its next resistance would be the horizontal lines at RM6.70 & RM7.00 (see Chart 2).


Chart 1: RHBCap's weekly chart as at July 26, 2010 (Source: Quickcharts)


Chart 2: RHBCap's monthly chart as at July 1, 2010 (Source: Tradesignum)

Based on the technical breakout, RHBcap could be a trading BUY.

CIMB has a bullish breakout

CIMB broke above its medium-term downtrend line at RM7.20 on July 21. Yesterday, it broke above its April 5 high of RM7.41. With these double breakouts, CIMB is continuing on its prior uptrend.


Chart: CIMB's daily chart as at July 26, 2010 (Source: Quickcharts)

Based on the technical breakout, CIMB is a trading BUY.

Monday, July 26, 2010

CPO clawed back above its medium-term uptrend line

On July 7, I have posted about a death cross for the Plantation index as well as CPO breaking below its medium-term uptrend line support at RM2450 (here). While the death cross persists for the Plantation index (see Chart 1), CPO has rebounded from RM2300 in early July to a recent high of RM2600 (see Chart 2). With this rebound, CPO has managed to claw back above its medium-term uptrend line (see Chart 3). The recovery in CPO could lead to a rebound in Plantation index & stocks, which could negate my earlier call to "reduce our shareholding of plantation stocks".


Chart 1: Plantation's daily chart as at July 26, 2010 (Source: Quickcharts)


Chart 2: CPO's daily chart as at July 23, 2010 (Source: ifs.marketcenter.com)


Chart 3: CPO's weekly chart as at July 16, 2010 (Source: ifs.marketcenter.com)

Market Outlook as at July 26, 2010

The market continued to recruit strength. This morning it broke above the strong horizontal resistance of 1350. FBM-KLCI gained 5.55 points to trade at 1351.23 as at 10.45am. If this upside breakout can sustain, FBM-KLCI could rally higher in the days ahead. Its next resistance will be at 1400.


Chart 1: FBM-KLCI's daily chart as at July 23, 2010 (Source: Tradesignum)

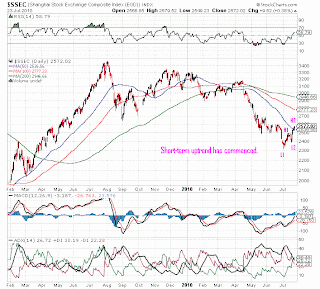
Globally, many stock markets have also shown similar rebound. The Shanghai's SSEC index has flashed a short-term uptrend (see Chart 2) and the DJIA is poised to do the same this week (see Chart 3).


Chart 2: SSEC's daily chart as at July 23, 2010 (Source: Stockcharts)


Chart 3: DJIA's daily chart as at July 23, 2010 (Source: Stockcharts)

With the upside breakout in FBM-KLCI, the earlier cautious market outlook has now turned bullish (provided FBM-KLCI stays above the breakout level of 1350). This price/index breakout should be given precedent over the bearish divergence in some indicators as well as in the volume.

Friday, July 23, 2010

MMCCorp may have a bullish breakout

MMCCorp has finally broken above its strong horizontal resistance at RM2.55 today. With this breakout, MMC may rally to test its next resistance at RM2.80 and thereafter at RM3.10.


Chart 1: MMCCorp's daily chart as at July 23, 2010_11.25am (Source: Quickcharts)


Chart 2: MMCCorp's weekly chart as at July 23, 2010_11.30am (Source: Quickcharts)

Based on the bullish breakout, MMCCorp could be a trading BUY. In view of the uncertainty in the overall market, you need to exercise your discretion on trading activity at the present moment.

Thursday, July 22, 2010

CBIP may have a bullish breakout

CBIP broke above its downtrend line at RM2.90 yesterday. Its next resistance may come from the horizontal line at RM3.60-65.


Chart:CBIP's weekly chart as at July 21, 2010 (Source: Quickcharts)

Based on the bullish breakout, CBIP could be a trading BUY. In view of the uncertainty in the overall market, you need to exercise your discretion on trading activity at the present moment.

Wednesday, July 21, 2010

Cocolnd did it. Can OFI do the same?

Over the past few weeks, we noticed strong buying of consumer stable stocks. Among these stocks, the top performers are Cocoaland Holdins Bhd ('Cocolnd') and Oriental Food Industries Holdings Bhd ('OFI'). Cocolnd broke above its strong horizontal resistance at RM1.50 on June 16 and has rallied steadily to about RM2.75 (its closing price at the end of the morning session today). See Chart 1 below.


Chart 1: Cocolnd's weekly chart as at July 19, 2010 (Source: Tradesignum)

Cocolnd is a small-cap consumer company, which reported a net profit of RM19.7 million on turnover of RM133 million for FYE31/12/2009. In FY2008, it recorded a net profit of RM8.7 million on turnover of RM129 million. Based on the closing price RM2.75, Cocolnd is trading at a trailing PER of 17 times (based on EPS of 16.4 sen for FY2010).

Like Cocolnd, OFI has also seen an increase in its top-line and bottom-line over the past 2 financial years. For FY2010, OFI's net profit increased by 126% to RM12.4 million on the back of a 6%-growth in turnover to RM126 million. Based on the closing price of the morning session of RM2.09, OFI is trading at a trailing PER of 10 times (based on EPS of 20.7 sen for FY2010).

The financial position of Cocolnd & OFI is about the same for their last financial year. Current ratios are very high at 2.9 times for Cocolnd or 3.8 times for OFI. Borrowing is minimal for both companies, with gearing ratio at less than 0.1 time for either company.

OFI has broken above its trading range between RM0.60 & RM1.90 on July 16 (as well as its January 2010 high of RM1.85). It has since surpassed the high of 2004 & the all-time high (recorded in 2000) of RM2.00 & RM2.08, respectively. In technical analysis, a stock that has surpassed its all-time high tends to continue to rise- like Cocolnd. Would OFI do a Cocolnd? We will have to wait & see.


Chart 2: OFI's weekly chart as at July 19, 2010 (Source: Tradesignum)

Based on valuation, I would prefer OFI to Cocolnd. However, I am very weary of a stock that has broken through so many resistance in such a short span of time. If one likes to get into this stock, the safer approach would be to wait for a pullback to either the psychological RM2.00 or the breakout level of RM1.90. However, a break below the RM1.90 level would be a bearish sign, especially if accompanied by high volume. Both Cocolnd & OFI are presenting us with trading opportunities. However, these trading propositions are very risky. If you choose to go in, do so with tight protective stop.

Tuesday, July 20, 2010

HELP- yet another bonus issue!

Bonus Issue, the Gifts That Keep Giving!!!

Another education group has proposed a Bonus Issue. This time, it's HELP International Corporation Berhad ('HELP'), which has just proposed a bonus of 3-for-5 today. The market may have gotten wind of the proposed bonus issue as HELP share price was bidden up from RM1.20 to an intra-day high of RM4.80 today.


Chart: HELP's daily chart as at July 20, 2010_9.30am (Source: Quickchart)

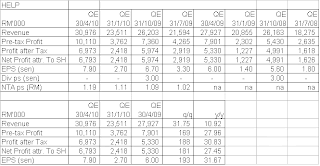
Based on its closing price at the end of the morning session of RM4.34, HELP is now trading at a trailing PER of 21 times (based on last 4 quarters' EPS of 20.6 sen). While not as exorbitantly over-priced as SEG, HELP is still fully valued.


Table 1: HELP's last 8 quarterly results

Based on demanding valuation, HELP is a stock is to avoid.

SEG- encore please!!!

Background

Recent I've posted on the fantastic rise of SEG (go here). SEG had earlier proposed a 1-to-2 Share Split, a 2-for-5 Bonus Issue and a Rights Issue of warrants on the basis of 1-for-2 at RM0.05 each. For some reason which I cannot fathom, the 1-to-2 Share Split and the 2-for-5 Bonus Issue were completed on July 12, while the warrant issue will be completed later, on July 22.

Recent & Historical Financial results

SEG's financial performance is affected seasonal factors, which resulted in higher top-line and bottom-line for the first calender quarter (which happens to be the first quarter for the company). We can see from Table 1 & Chart 1 below that SEG's turnover & profits are in a rising trend over the past 2 years. This has been the trend since FY2007 (see Table 2 below). Based on this trend, I have projected SEG's turnover & profits for FY2010 to be 35% & 40% higher than that of FY2009.


Table 1: SEG's last 8 quarterly results


Chart 1: SEG's last 8 quarterly results


Table 2: SEG's last 10 yearly results

Valuation

SEG (trading at RM2.43 as at 11.00 am) is now trading at a trailing PER of 46 times (based on last 4 quarters' EPS of 5.3 sen) or at a forward PER of 40 times (based projected EPS of 6.0 sen). At this multiple, SEG is grossly overvalued.

Technical Outlook


SEG is on an exponential rise! There is no sign of weakness yet.


Chart 2: SEG's daily chart as at July 19, 2010 (Source: Tradesignum)

Conclusion

Based on demanding valuation, SEG is a stock to avoid. My concern is that the current strength in the share price may not persist after the last goody- the proposed warrant issue- is completed. What's there to look forward to? Upside earning surprise is possible but it has been all priced in.

Monday, July 19, 2010

Kianjoo may have a bullish breakout

Kianjoo has just broken above its strong horizontal resistance at RM1.33. Last Friday, it broke above its symmetrical triangle at RM1.23. With these twin upside breakout, Kianjoo could finally start on a uptrend. Its immediate resistance would be at RM1.50 & then RM1.60.


Chart: UEMLand's weekly chart as at July 19, 2010_10.10am (Source: Quickchart)

Based on the bullish breakout, Kianjoo could be a good trading BUY or a medium-term investment. In view of the uncertainty in the overall market, you need to exercise your discretion on trading activity at the present moment.

UEMLand may have a bullish breakout

UEMland has just broken above its trading range at RM1.60. This could signal the continuation of its prior uptrend. Its immediate resistance would be at the high of RM1.70 recorded in June 2009.


Chart: UEMLand's weekly chart as at July 19, 2010_10.10am (Source: Quickchart)

Based on the bullish breakout, UEMland could be a good trading BUY. In view of the uncertainty in the overall market, you need to exercise your discretion on trading activity at the present moment.

MBSB- uptrend to continue

MBSB has just surpassed its recent high of RM1.35. This could signal the continuation of its prior uptrend. Its immediate resistance would be at RM1.60 & then RM1.70.


Chart: MBSB's weekly chart as at July 19, 2010_10.00am (Source: Quickchart)

Recently, MBSB reported a very good set of results for its 1Q2010 (QE31/3/2010). Its net profit jumped to RM43.2 million from RM5.8 million last year, while turnover increased to RM279 million from RM104 million. The better performance was attributable to growth in the personal financing business. Based on this set of results, its annualized EPS for FY2010 would be about 24.7 sen. At RM1.38, MBSB is trading at a PER of 5.6 times.

Based on the above, MBSB could be a good trading BUY. In view of the uncertainty in the overall market, you need to exercise your discretion on trading activity at the present moment.

Friday, July 16, 2010

CIMB issues 4 Callable Bull Certificates

CIMB Bank Bhd has issued the first four Callable Bull Certificates (CBLC) in the country, on AirAsia Bhd, Gamuda Bhd, Genting Bhd and Berjaya Corp Bhd. A CBLC is quite similar to a call warrant ('CW'), except for a Mandatory Call Event ('MCE'). A MCE is the issuers' right to call the CBLC, which leads to the suspension of the CBLC, should it reach the call price, prior to the expire date of the CBLC.

The call price is either at or above the exercise price of the underlying instrument. If the call price is equal to the exercise price, investors will not receive any cash amount. If the call price is different from the exercise price, cash settlement will be done based on an established formula.

Personally, I don't like this feature called MCE. If the underlying security is rising and consequently the CBLC is also going in favor of the holders of CBLC, the issuer can cut short a winning hand by calling in the CBLC. In view of this feature, CBLCs should not attract high premium like CWs or normal company-issued warrants. A fair premium for CBLCs could be about 3-5%.


Table: CBLC Valuation Table as at July 16, 2010

Lonbisc may have a bullish breakout

Lonbisc has just broken above its downtrend line at RM1.13-15. Its next ressitance levels are at RM1.30, RM1.50 & RM1.65.


Chart: Lonbisc's weekly chart as at July 16, 2010_9.25am (Source: Quickchart)

Based on the above, Lonbisc could be a good trading BUY.

Thursday, July 15, 2010

Robots taking over the trading floor

A recent article in Planet Yelnick entitled "The Herd Leaves the Market to the 'Bots" is well worth reading. To wit:
The WSJ noted two odd phenomena in this market: small investors have largely bailed out, and (perhaps as a consequence) individual stocks in the S&P 500 have been tracking the index itself to a degree not seen since the 1987 crash (see Chart 1 below).

The average correlation is 44% (since 1980), but is now 81%, higher than in the crash of 2008 (79%) and approaching the all-time high in 1987 (83%). The conclusion from the correlation: fear drives investors to treat the market as a homogenous entity. Adding in the exodus of retail traders, this time the implication is the market has been left for the index 'bots.


Chart: US Stocks' correlation to the S&P500 index (Source: WSJ)

The article is quite technical, with a fair bit of reference to Elliot Waves counts. If you have the patience, I would suggest that you read the article carefully. The writer opined that "...the high correlation is an extreme example of herding behavior..." and in the worst case scenario, "...the floor can drop out of this market rapidly...". Now, that's discomforting.

Who's afraid of a death cross?

Some analysts or pundits have questioned the relevance of the death cross. Among them is Mark Hulbert, a highly-regarded columnist for Market Watch who wrote an article entitled "The kiss of the death cross". To wit:
It turns out that the death cross has had a mediocre track record at best over the last two decades. To be sure, it's had some great recent successes -- such as the one that occurred in December 2007, very early in the 2007-2009 bear market. But there have been a number of other failures -- such as one that occurred in October 2005, in the middle of the 2002-2007 bull market.

Overall, in fact, there has been no statistically significant difference since 1990 between the average performance following death crosses and all other market sessions.

Like many technical signals, the death cross is not a sure thing. Death cross is derived when the 50-day SMa line crossed below the 200-day SMA line. Like the moving average line & MACD indicator, the death cross (as well as its more favorable cousin, the golden cross) works well in a trending market. In a volatile & non-trending market, oscillators such as RSI & Stochastic are more accurate. I have attached below the daily chart for DJIA from July 1998 up to yesterday. During this period, the DJIA experienced prolonged period of volatile sideway trading (from 1999 to 2001 and from 2004 to 2006). In these two periods, I have counted about 8-10 death/golden crosses. However, a death/golden cross is more accurate after a prolonged period of trending market. (For a clearer chart of DJIA, go here).


Chart 1: DJIA's daily chart as at July 12, 2010 (Source: Yahoo Finance)

For a different view of the efficacy of the death cross, check out the article entitled "New Long-Term Sell Signal Generated" written by highly-regarded technical analyst, Carl Swenlin of Decision Point. His conclusion is worth careful reading. To wit:
Bottom Line: A new long term stocks SELL signal has been generated based upon a “death cross” (opposite of “golden cross”) of the 50- and 200-EMAs. Decisions in the intermediate and short term now need to take this into account. Nevertheless, short term indicators continue to be bullish and and there are now positive divergences on medium-term indicators. So we have a positive theme developing in a negative longer-term context, but we should consider it to be a temporary development.

I have appended below the daily chart for MSCI World Index. We can see a death cross has just happened. There were 5 death/golden crosses in the past 12 years. Except for the death/golden cross recorded in 1998 [denoted as C], all the other death/golden crosses [denoted as A, B, D & E] have accurately predicted the next direction of the market.


Chart 2: MSCI World Index's daily chart as at July 14, 2010 (Source: Rubbernet)

Finally, I have also appended below the table of the Global Market Indexes which shows that 11 out of the 16 indexes being tracked have flashed a death cross.


Table: Global Equity Indexes as at July 14, 2010

Based on the presence of death cross in many equity markets, we must act cautiously in this market. However, the current short-term bullishness may present some opportunity if you are a nimble trader.

Market Outlook as at July 15, 2010

Our present market remains me of the market in 2007. Despite bearish divergence in some indicators & the declining volume, the market in 2007 swung wildly with an upward bias. Today, we see the same signs- bearish divergence in indicators & declining volume- but the market also seems to defy all odd. To me, the present market is tracing out a rounding top in the same manner that had happened in 2007. The completion of this top would happen when the market suffers a severe drop which would trigger the death cross (when the 50-day SMA line crosses below the 200-day SMA line). Until then, we must remain cautious.


Chart: FBM-KLCI's weekly chart as at July 14, 2010 (Source: Tradesignum)

Let's take note that the mischievous bull of 2007 ended with a bang where it zoomed up to a new high before expiring. Would the current bull pull off a similar trick?

Xinquan did it. Can XDL do the same?

Background

One of the PRC-based companies listed on our exchange has done quite well in the past few weeks. That stock is Xingquan International Sports Holdings Ltd ('Xinquan'), which is involved in the manufacture of shoe soles; outdoor & indoor sports & leisure shoes; outdoor & indoor sports & leisure apparels & accessories. I had posted on Xinquan earlier. Go here.


Chart 1: Xinquan's daily chart as at July 14, 2010 (Source: Quickchart)

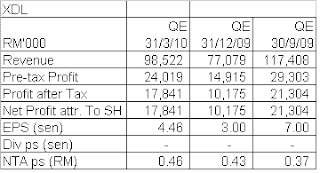
Another PRC-based company which seems to be attracting some attention lately is XIDELANG Holdings Ltd ('XDL'). XDL is involved in the design, manufacture, and marketing of sports shoes, sports apparel, accessories, and equipment. It reported an EPS of 4.5 sen for QE31/3/2010. Based on this, XDL's annualized EPS is about 18 sen. XDL, which closed at RM0.43, is now trading at a PER of only 2.4 times.


Table: XDL's last 3 quarters' financial results

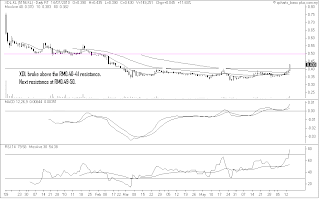
Yesterday XDL broke above its strong horizontal resistance at RM0.40-41. This bullish breakout could be the start of an upleg for the stock. Its immediate resistance is at RM0.49-50, while its immediate support is at RM0.40-41.


Chart 2: XDL's daily chart as at July 14, 2010 (Source: Quickchart)

Conclusion

Based on good financial performance, attractive valuation & positive technical outlook, XDL could be a good stock for medium-term investment.
(Warning: Despite the above positive comments, we must be cautious taking long position in PRC stocks due to the high incidence of accounting irregularities.)

Note: There is one more PRC company that did very well in the past 4 weeks and that company is K-Star Sports Limited ('KStar'), which is also involved in the design, manufacture, and distribution of sports footwear under the Dixing and K-Star brand names in the People’s Republic of China (PRC). KStar rose from an intra-day low of RM1.81 on June 16 to an intra-day high of RM2.62 yesterday.

Wednesday, July 14, 2010

Kencana & Waseong may have bullish breakout

Two Oil & Gas stocks have broken above their respective downtrend line. The first stock is Kencana, which has broken above the downtrend line at RM1.50 as well as the strong horizontal line at RM1.52-53. Its next resistance is at RM1.68-70.


Chart 1: Kencana's daily chart as at July 14, 2010_4.10pm (Source: Quickchart)

The next stock is Waseong, which has broken above the downtrend line at RM2.20 as well as the strong horizontal line at RM2.30. Its next resistance is at RM2.40.


Chart 2: Waseong's daily chart as at July 14, 2010_4.15pm (Source: Quickchart)

Based on the technical breakout, Kencana & Waseong could be good trading BUYs.

Monday, July 12, 2010

Axiata may have a bullish breakout at RM4.00

Axiata broke above its downtrend line (R2-R2) in June. This morning, it broke above its horizontal line, H2 at RM4.00. With this later breakout, Axiata may put in a decent rally similar to January-February this year when it charged up from RM3.25 to RM4.00.


Chart : Axiata's daily chart as at July 12, 2010_10.00am (Source: Quickchart)

Based on the above, Axiata may be a good trading BUY.

Friday, July 09, 2010

Allianz-ICPS, a different route to get into Allianz

Background

The ex-date for Allianz's Rights Issue of Irredeemable Convertible Preference Shares (ICPS) was on July 5. The basis for the Rights Issue is 125 new ICPS for every 100 ordinary shares owned. The main terms of the Rights Issue are:

1. Subscription Price: RM3.18
2. Tenure: Perpetual
3. Conversion Price: 1 ordinary share for each ICPS surrendered
4. Conversion Period: 12 months after the listing of ICPS
5. Dividend Rate: 1.2 times the Dividend Rate of the ordinary share

From the above terms, you can see that ICPS may be preferred over the ordinary share as it carries a higher dividend rate. For more, go here.

Computation of Allianz's Theoretical ex-Rights Price

Allianz closed at RM4.65 on the last cum-date (July 5). If we assume that the ICPS is the same as the ordinary share, Allianz's Theoretical ex-Rights Price can be calculated as follows:
= [(cum-date Price X 1) + (Subscription Price x 1.25)] / 2.25
= [ (4.65 x 1) + (3.18 x 1.25)] / 2.25
= 3.83

What's a good price to purchase Allianz's ICPS Rights?

Assuming the ICPS has the same value as the ordinary share , the value of Allianz's ICPS Rights (Code: ALLIANZ-PR) can be computed by deducting the Subscription Price from Allianz's share price (closed at RM3.68 at the end of the morning session). It would be about 50 sen. ALLIANZ-PR closed at 40 sen at the end of the morning session.

Conclusion

Based on the above, ALLIANZ-PR may represent a cheaper route for getting into Allianz. Buy the Rights; subscribe for ICPS; and convert into the share after one year holding period.


Chart : Allianz's daily chart (with unadjusted price data) as at July 9, 2010_12.00am (Source: Quickchart)

Thursday, July 08, 2010

SEG- A free lunch awaits you?

Background

SEG International Bhd ('SEG') is one of the top performer in our market for the past six months. It rose from RM0.95 (as at 31/12/2009) to a recent high of RM4.75 (on June 24)- chalking up a gain of 500% over a 6-month period!! See Chart 1 below.


Chart 1: SEG's weekly chart as at July 6, 2010 (Source: Tradesignum)

Historical, Recent & Projected Financial Results

What would justify the sharp rise in SEG? A quick look at its last quarterly result for QE31/3/2010 shows a decent improvement in its top-line & bottom-line. Its net profit increased by 42% y-o-y to RM9.5 million on the back of a 35%-increase in turnover to RM55 million. A q-o-q comparison is quite meaningless since SEG is involved in a seasonal business.


Table: SEG's quarterly result for QE31/3/2010 compared

If you assumed that turnover & profits for FY2010 is 35% & 40% higher than that of FY2009, the 10 years financial track record from FY2001-2010 can be tabulated below.


Chart 2: SEG's Actual & Projected Financial Performance for FY2001-2010

Valuation

Based on projected EPS of 17 sen for FY2010, SEG (closed at RM4.52 at the end of the morning session) is now trading at a PER of 27 times. At this PER, SEG is grossly over-valued.

Proposed Share Split, Bonus Issue & Rights Issue of Warrant

SEG has proposed a 1-to-2 Share Split and thereafter a 2-for-5 Bonus Issue. The ex-date for this exercise is on July 12. At this moment, it is not clear whether it will still proceed with the proposed warrant issue (on the basis of 1-for-2 shares held after the Share Split and Bonus Issue). For more, go here. I believe this proposed exercise is the reason why the share price of SEG has been rising so sharply.

Conclusion

Based on high valuation, SEG is expected to underperform in the medium to longer term (after the completion of the Proposed Share Split, Bonus Issue & Rights Issue of Warrant). As such, it would be a good idea to take profit on this stock now.

Wednesday, July 07, 2010

PJI- to get in or not to get in??

PJI is involved in property development as well as engineering activities for the civil, building, mechanical and electrical, infrastructure, power substations, transmission lines, water treatment plants, renewable energy, environment services and other related engineering works.

PJI has just broken above its strong horizontal resistance at RM0.11. It may test the next resistance at the horizontal line RM0.22. Before you get into this stock, consider the following:

1. PJI's financial performance has been very unexciting. For the 9-month ended 31/3/2010, it reported a net loss of RM3.8 million on turnover of RM59.7 million. It has however achieved a net profit of RM3.2 million on turnover of RM99.7 million last financial year (FY2009). In FY2008, it incurred a net loss of RM3.7 million on turnover of RM132 million.

2. Since its listing in 1999, PJI had lost 14 sen of its par value of 20 sen. To erase the accumulated losses from its books, PJI has proposed a capital reduction scheme (via a Par Value Reduction whereby its Paid-Up Share Capital of RM81,209,333 shall be reduced to RM40,604,667) & a recapitalization exercise (via a Rights Issue on the Basis of 2 Rights Shares Together with 3 Free Detachable Warrants for Every 4 PJI Shares Held After the Proposed Par Value Reduction at an Indicative Issue Price of RM0.11 per Rights Share). For more, go here.

I know that some investors get very excited about new warrant issues, share splits and bonus issues but these exercises do not add much value to the companies. While one can justify why Topglove has risen on the back of similar exercises (or, more appropriately, despite such exercises), I cannot see why investors should get excited about similar exercises undertaken by an under-performer like PJI.


Chart: PJI's weekly chart as at July 7, 2010_3.15 pm (Source: Quickcharts)

Based on the above, I would give PJI a miss despite what looks like a promising technical breakout.

Plantation stocks may drop further

We have just sighted a death cross for the Plantation index- with the 10-week SMA line (equivalent to the 50-day SMA line) crossing below the 40-week SMA line (equivalent to the 200-day SMA line). The last time we witnessed a death cross for the Plantation index was in July 2008. See Chart 1 below.


Chart 1: Plantation's weekly chart as at July 6, 2010 (Source: Quickcharts)

The death cross for the Plantation index happened after CPO broke below its medium-term uptrend line support at RM2450. CPO's next support is at the horizontal line RM2000. See Chart 2 below.


Chart 2: CPO's weekly chart as at July 6, 2010 (Source: ifs.marketcenter.com)

The weakness in CPO coincides with the weakness in Crude Oil. We can see from Chart 3 below that WTIC has flashed a death cross!


Chart 3: WTIC index's daily chart as at July 6, 2010 (Source: Stockcharts)

Based on the bearish technical outlook of the Plantation index, we should reduce our shareholding of plantation stocks.

Note: I think the weakness in CPO is due to increased supply. During my recent class reunion, I was pleasantly surprised to learn that 4 of my classmates have ventured into palm oil plantation, each with estates of about 100-200 acres. I was also very surprise to learn that vacant agricultural land in my home state of Sabah can fetch a price of RM20,000 per acre. The gold rush effect has drawn many into the plantation sector, with the bulk of them venturing into oil palm cultivation. The ensuing increase in the supply would affect the prices of CPO for many years to come. I understand that plantation owners would lose money if CPO were to trade below RM1700 per tonne.

Tuesday, July 06, 2010

BJToto- good for medium-term investment

BJToto was sold down quite significantly over the past few days due to the increase in the gaming duties from 6% to 8% w.e.f. July 1. The increased duties will affect pure gaming operator such as BJToto- an impact of 6-8% according to Kenanga Investment Bank.

However, BJToto is in the process of raising RM800 million via a medium term note programme (MTN). It explained that the proceed would be used to refinance existing bank borrowings and for working capital. BJToto has a net gearing of 0.4 time as per its accounts for QE31/4/2010 (total borrowings of RM450 million less cash & bank balances of RM257 million). Assuming that it refinanced the entire amount of its bank borrowings of RM450 million, the balance of the MTN programme of RM350 million is still available for "working capital". An on-going gaming operator is hardly the kind of business that requires such a large sum of money for working capital. In fact, its existing operation generated cash flow of RM451 million for FY2010 & RM489 million for FY2009. Why is BJToto raising such a large sum of money?

There are two possible reasons for this fund-raising activities:
1. To finance the start-up capital for its 20%-owned associate, Berjaya Lottery Vietnam Ltd; or
2. To effect a large special dividend payout to its shareholders. In FY2010 & FY2009, BJToto paid dividend totaling RM433 million & RM241 million, respectively.

I believe the second scenario is a more likely reason for the MTN programme. This is because its parent company, Berjaya Land Bhd ('BJLand') has a large convertible bond due for redemption in August 2011. The outstanding sum is about RM711 million. BJLand, which owned 51% of BJToto, must be counting on a larger dividend payout from BJToto to ease its cash flow requirement. With the possible available fund of RM350 million from the MTN programme, BJToto could announce a special dividend of 25 sen on top of its normal dividend payout of about 30 sen. If this materialized, BJLand may receive RM379 million dividend from BJToto. Minority shareholders could possibly receive dividend totaling 55 sen for the next financial year.

Technical Outlook

From the chart below, we can see that BJToto is in a long-term uptrend line (SS), with support at RM3.95-4.00. Its medium-term downtrend line (RR) would cap the share at RM4.70-75.


Chart: BJToto's daily chart as at July 2, 2010 (Source: Tradesignum)

Based on good technical outlook & a possible bumper dividend ahead, BJToto could be a good buy for a medium-term investment.

Monday, July 05, 2010

Interesting times ahead...

Over the past 1 week, another index (RTSI) had recorded a negative golden cross (or, the death cross). This means that the total number of indexes with death cross have risen to 8. I expect 4 more indexes to join the list this week. They are DJIA, S&P500, BSE & STI. Only 3 indexes are likely to be spared this dreadful technical event this week. They are DAX, Kospi & FBM-KLCI.


Table: Main market indices as at June 25, 2010 (Source: Stockcharts for all indexes, except FBM-KLCI where I rely on Tradesignum)

Despite this gloomy technical outlook, there are signs that risk aversion which gripped investors may be weakening. A widely used measure of market risk is VIX which is often referred to as the "investor fear gauge". From Chart 1 below, we can see that VIX, which spiked up in April, has corrected back substantially over the past 2 weeks.


Chart 1: VIX daily chart as at July 2, 2010 (Source: Stockchart)

Since the recent concern among investors is related to the fear of credit default among weaker European nations (which are commonly referred to as PIIGS) as well as corporate borrowers, one measure that we should look at is the TED Spread. This is the price difference between three-month futures contracts for U.S. Treasuries and three-month contracts for Eurodollars having identical expiration months. The TED spread can be used as an indicator of credit risk because U.S. T-bills are considered risk free while the rate associated with the Eurodollar futures is thought to reflect the credit ratings of corporate borrowers. From Chart 2 below, we can see that TED Spread had spiked up since April and has begun to correct in June.


Chart 2: TED daily chart as at July 2, 2010 (Source: Stockchart)

In the uncertain period of April to June, investors piled into safe havens such as USD & gold. This led to a sharp rise in USD & gold. Over the past few days, both USD & gold tumbled sharply & broke below their 50-day SMA lines. Is this the start of a correction for USD & gold? We will have to wait & see. See Chart 3 & 4 below.


Chart 3: GOLD daily chart as at July 2, 2010 (Source: Stockchart)


Chart 4: USD daily chart as at July 2, 2010 (Source: Stockchart)

Conversely, Euro- the currency in the middle of the PIIGS financial crisis- has begun to stabilize. Has it made a bottom? See Chart 5 below.


Chart 5: EURO daily chart as at July 2, 2010 (Source: Stockchart)

It would be a very interesting market for the next few weeks as investors slowly lose their risk aversion & possibly move back into the markets. Would this be enough to overcome the dreadful technical implication of the many death crosses that would confront them? We will have to wait & see.